US Data Center Map & Directory
5,200+ facilities across 48 states and territories · $1,183B in tracked mega projects ·
Maintained and reviewed by Malachi Rein, LEED AP BD+CDataset version
As of October 2026, the United States has an estimated 5,274 data centers across 46 states, the District of Columbia, and Puerto Rico, 1,771 of them verified in OpenStreetMap, with Virginia holding the most. The 56 tracked mega projects total about $1.2 trillion in announced investment and 106.2 GW of planned capacity, of which $490 billion is developer-stated campus cost.
Of the 48 tracked mega projects whose campus location is public to the site or address level, 43 sit within 5 miles of a 230 kV or higher transmission line, per HIFLD transmission data current to September 2023, computed 2026-10-02. The other 8 projects are located only to a city or county centroid, which can sit several miles from the parcel, and are not counted. Source: HIFLD
Dataset version · OSM-verified facility layer, ODbL 1.0; compilation free with attribution. Method and licenses · Frozen release with checksums
Facility locations and project details are compiled from public sources and may be incomplete, outdated, or inaccurate. Informational only; not a basis for business, investment, or policy decisions.
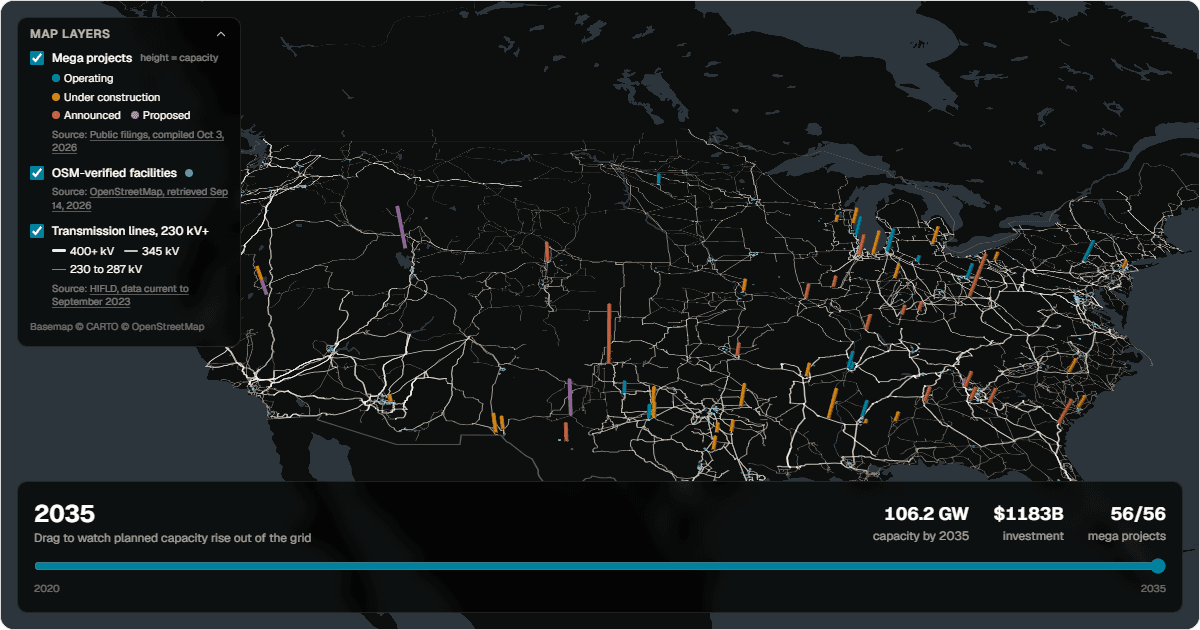
Each column is a tracked mega project. Taller means more planned megawatts. Click the map to zoom, pan, and tilt it. Drag the timeline to watch committed capacity rise. Dots are OSM-verified existing facilities. The map’s download button saves a high-resolution PNG.
State map for research and reports
States shaded by verified facility count, mega projects sized by planned capacity. Click a state to drill into its own map and facility list. Downloads carry the source line and dataset date.
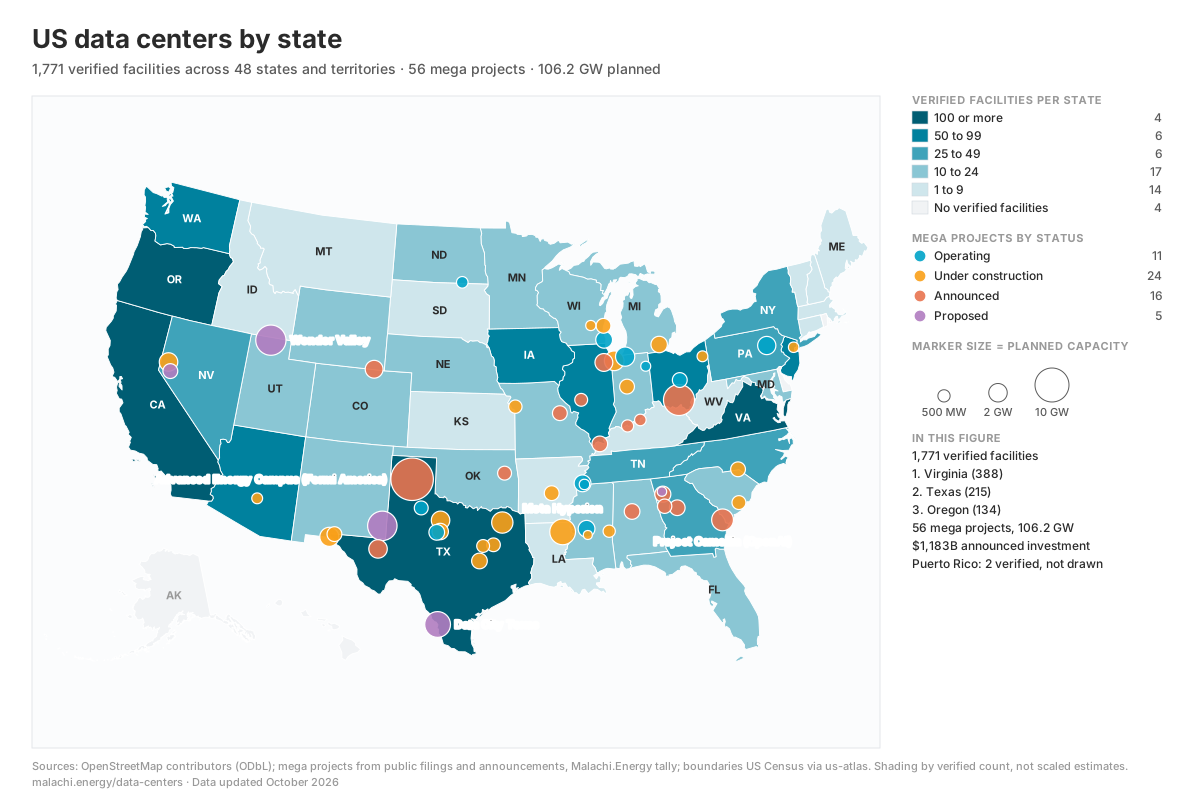
US data centers at a glance
As of October 2026, Malachi.Energy tracks roughly 5,274 data centers across 46 states, the District of Columbia, and Puerto Rico, built from 1,771 facilities verified in OpenStreetMap and scaled to industry totals from Baxtel. Virginia has the most, with 388 verified facilities (an estimated 793 in total) concentrated in Ashburn, Sterling, and Manassas. US data centers used about 192 TWh of electricity in 2024, 4.7% of national generation, and Lawrence Berkeley National Laboratory projects 521 to 843 TWh by 2030. The 56 mega projects tracked below add up to about $1.2 trillion in announced investment and 106.2 GW of planned capacity, led by Texas with 36.0 GW. The largest single project is Advanced Energy Campus (Fermi America) in Carson County, TX at 17.0 GW, still announced.
Energy figures: United States Data Center Energy Usage Report: 2025 Update, Lawrence Berkeley National Laboratory (June 2026). Facility counts: OpenStreetMap contributors (ODbL), scaled to Baxtel data center market directory totals. Mega projects: Malachi.Energy tally of public filings and announcements. Method notes on the methodology page.
Key takeaways
- 5,200+ US data centers across 46 states, the District of Columbia, and Puerto Rico as of October 2026, 1,771 of them OSM-verified.
- Virginia leads with 388 verified facilities (about 793 estimated), ahead of Texas (215 verified) and Oregon (134 verified).
- US data centers consumed 192 TWh in 2024, 4.7% of US electricity (LBNL 2025).
- Demand is projected at 521 to 843 TWh by 2030, roughly 9.5% to 15.3% of US generation (LBNL 2025).
- 56 tracked mega projects total about $1.2 trillion and 106.2 GW of planned capacity; Texas alone accounts for 36.0 GW. Only $490 billion of that total is developer-stated campus cost; the rest mixes bond caps, power plant capex, and program-wide pledges.
States by Facility Count
~793 facilities
388 verified
Ashburn · Sterling · Manassas
All Virginia data centers~779 facilities
215 verified
San Antonio · Dallas · Richardson
All Texas data centers~431 facilities
134 verified
Boardman · Hillsboro · Umatilla
All Oregon data centers~312 facilities
115 verified
Santa Clara · San Jose · Los Angeles
All California data centers~293 facilities
91 verified
New Albany · Cincinnati · Lebanon
All Ohio data centers~225 facilities
70 verified
Tukwila · Seattle · East Wenatchee
All Washington data centers~206 facilities
64 verified
Chandler · Phoenix · Goodyear
All Arizona data centers~187 facilities
58 verified
Altoona · Council Bluffs · Des Moines
All Iowa data centers~187 facilities
58 verified
Secaucus · Clifton · Piscataway Township
All New Jersey data centers~174 facilities
54 verified
Chicago · Elk Grove Village · Itasca
All Illinois data centers~148 facilities
46 verified
Pittsburgh · Allentown · Berwick
All Pennsylvania data centers~126 facilities
39 verified
Las Vegas · McCarran · Henderson
All Nevada data centers~122 facilities
38 verified
Alpharetta · Atlanta · Douglasville
All Georgia data centers~119 facilities
37 verified
Niagara Falls · Orangeburg · New York
All New York data centers~90 facilities
28 verified
Franklin · Memphis · Brentwood
All Tennessee data centersMega Projects
$1,182.5B+ in investment across 56 projects · 106.2 GW planned capacity
Stargate (Abilene, TX)
OpenAI / SoftBank / Oracle
OpenAI's flagship Stargate campus. Buildings 1-4 serving about 420 MW of IT load as of September 2026, buildings 5-8 structurally complete, full 1.2 GW projected by late 2026. A 600 MW expansion was scrapped in March 2026. Investment is Epoch AI's projected site cost at full buildout; the $100B figure often quoted is the program-wide Stargate commitment.
Target: 2026Source: Epoch AI (Sep 2026)Basis: developer disclosed MW, third-party analyst estimateDetails & sources
Advanced Energy Campus (Fermi America) (Carson County, TX)
Fermi America
Project Matador, the Texas panhandle campus now marketed at 17 GW with roughly 6 GW permitted. TensorWave signed a 15-year, $6.5B lease for the first 222 MW building in August 2026, with deliveries staged for the second half of 2027. Satellite imagery through spring 2026 showed land clearing, not vertical construction.
Target: 2027Source: Bisnow (Aug 2026)Basis: developer disclosed MW, press reportedDetails & sources
Meta Prometheus (New Albany, OH)
Meta
Meta's Ohio AI campus in the New Albany data center corridor. About 560 MW of IT load operational as of September 2026, with full buildout projected for early 2027.
Target: 2026Source: Epoch AI (Sep 2026)Basis: developer disclosed MW, third-party analyst estimateDetails & sources
Meta Hyperion (Richland Parish, LA)
Meta
Meta's largest campus. Commitment raised in July 2026 from 2 GW and $27B to 5 GW and $50B+; roughly 2 GW expected by 2030 and the full campus around 2032.
Target: 2030Source: CNBC (Jul 2026)Basis: developer disclosed MW, developer-stated campus costDetails & sources
AWS New Carlisle (New Carlisle, IN)
Amazon Web Services
AWS hyperscale campus in northern Indiana: 18 of 32 planned buildings operational and 14 under construction as of mid-2026, drawing about 2.25 GW at full buildout no earlier than late 2027. AWS said in July 2026 it had already invested $13.8B, above the $11B announced in 2024.
Target: 2027Source: Measured AI (Jun 2026)Basis: press or analyst reported MW, developer-stated campus costDetails & sources
Microsoft Wisconsin (Mount Pleasant, WI)
Microsoft
Microsoft's Fairwater AI campus on the former Foxconn site. The first $3.3B facility became fully operational in June 2026; a second $4B facility is under construction for 2028.
Target: 2026Source: Wisconsin Public Radio (Jun 2026)Basis: press or analyst reported MW, developer-stated campus costDetails & sources
Vantage Frontier (Albany, TX)
Vantage Data Centers
Vantage Data Centers' massive West Texas campus near Abilene, part of the emerging Texas data center corridor.
Target: 2026Source: Epoch AI (Apr 2026)Basis: developer disclosed MW, developer-stated campus costDetails & sources
AVAIO Digital Leo (Pulaski County, AR)
AVAIO Digital
AVAIO Digital's 296-acre Project Leo campus in Pulaski County, with 150 MW contracted from Entergy Arkansas and demand of up to 1 GW at full build; the first phase is $6B of more than $21B through full development. The developer reports it has broken ground, and said in July 2026 that the first two buildings would be operational by 2028.
Target: 2028Source: Arkansas Economic Development Commission (Jan 2026)Basis: developer disclosed MW, developer-stated campus costDetails & sources
Project Bunkhouse (Digital Realty) (Bartow County, GA)
Digital Realty
Digital Realty's Stilesboro campus in Bartow County, northwest of Atlanta, filed under applicant Taurus DC SPE LLC and rezoned in June 2025. The county put the plan at about 1.3 GW of computing capacity and about $18B at build-out in August 2026; the April 2025 regional review filing listed 1,830 MW and $19B, with completion by 2035.
Target: 2035Source: Bartow County (Aug 2026)Basis: utility, iso, or government filing MW, developer-stated campus costDetails & sources
Project Sail (Prologis) (Coweta County, GA)
Prologis
Prologis campus south of Atlanta. Coweta County approved rezoning 3-2 in April 2026; residents sued in May 2026 to void the approval and the suit is pending.
Source: Data Center Dynamics (Apr 2026)Basis: utility, iso, or government filing MW, press reportedDetails & sources
Google Kansas City (Clay County, MO)
Google's Project Mica, a second Kansas City campus in Clay County, confirmed in February 2026 with construction underway. The $10B figure is the Port KC revenue bond cap.
Source: Baxtel (Feb 2026)Basis: press or analyst reported MW, bond authorization capDetails & sources
Novva Borealis (Mesa, AZ)
Novva Data Centers
Novva Data Centers' 300 MW campus on 160 acres in southeast Mesa, built in two phases over a decade with water-free cooling. The first phase, 96 MW of critical IT load, was slated to launch in late 2026.
Target: 2026Source: Novva Data Centers (Aug 2024)Basis: developer disclosed MW, developer-stated campus costDetails & sources
How this data was compiled
- Verified facilities
- 1,771 buildings tagged as data centers in OpenStreetMap, pulled through the Overpass API and assigned to states by point-in-polygon against Census boundaries. Each has a mapped location. 1,261 have a street address. 899 are tagged in OpenStreetMap; the other 362 come from public-domain address points at or beside the building (USDOT National Address Database and county sources, via Overture Maps), each reviewed by hand. The address_basis column says which. Licensed ODbL.
- Estimated totals
- OpenStreetMap captures roughly a third of US facilities. The headline 5,274 is Baxtel’s national count. Virginia, Texas, and California use Baxtel's own state counts. The remaining 3,390 are allocated across the other 45 jurisdictions at 3.22 times their verified count, so the state estimates sum to the headline exactly. Rankings in the text use verified counts, because the multiplier can reorder states that are close. The directory covers 46 states, the District of Columbia, and Puerto Rico.
- Mega projects
- 56 named campuses of roughly 100 MW and up, compiled from developer releases, utility and county filings, and dated local reporting. A project is listed only when both planned capacity and an investment figure are public; each project page states the basis of both figures and links its source. Every project is re-checked against its source whenever the project list is refreshed;
last_verified_atdates the last check. “Operational” means the first phase serves load. Capacity is planned, not delivered, power. - Energy figures
- National consumption and 2030 projections are LBNL 2025, the Lawrence Berkeley National Laboratory report prepared for the US Department of Energy. Water use is from the LBNL 2024 report. Last data change: .
Reconciling the facility count
| Component | OSM verified | Estimated |
|---|---|---|
| Virginia (Baxtel state count) | 388 | 793 |
| Texas (Baxtel state count) | 215 | 779 |
| California (Baxtel state count) | 115 | 312 |
| 45 other jurisdictions at 3.22x | 1,053 | 3,390 |
| Total (Baxtel national count) | 1,771 | 5,274 |
What the investment total measures
| Basis | Projects | USD billions |
|---|---|---|
| Developer-stated campus cost | 24 | 483 |
| Press reported | 17 | 334.3 |
| Bond authorization cap | 2 | 175 |
| Multi-site or statewide commitment | 3 | 81 |
| Third-party analyst estimate | 5 | 61 |
| On-site power plant cost only | 2 | 41 |
| Developer-stated first-phase cost | 3 | 7.2 |
| Headline total (all bases) | 56 | 1,182.5 |
Developer-stated campus and first-phase costs are the only bases that measure the same thing: $490.2 billionof the total. Bond caps, power plant capex, statewide pledges, and press or analyst figures are listed as announced, not as comparable spend.
Transmission proximity (derived)
Transmission distances are computed from Electric Power Transmission Lines, Homeland Infrastructure Foundation-Level Data (data current to September 2023), filtered to 230 kV and above (10,490 line segments), as the geodesic distance from each project coordinate to the nearest line segment, computed on 2026-10-02. Only projects located to the site or address level are counted; a city or county centroid can sit several miles from the parcel, wider than the 5 miles test itself. The transmission layer has its own source date and does not move with the dataset version. HIFLD layer.
Data dictionary for the exports
capacity_basis
disclosed: Developer disclosed (22 projects, 61,776 MW)filing: Utility, ISO, or government filing (14 projects, 23,524 MW)reported: Press or analyst reported (14 projects, 12,600 MW)estimated: Malachi.Energy estimate (6 projects, 8,300 MW)
investment_basis
campus-capex: Developer-stated campus costfirst-phase-capex: Developer-stated first-phase costbond-authorization: Bond authorization cappower-plant-capex: On-site power plant cost onlyprogram-commitment: Multi-site or statewide commitmentpress-reported: Press reportedanalyst-estimate: Third-party analyst estimate
location_basis
site: Campus footprint identifiedaddress: Public address, geocodedcity-centroid: City centroidcounty-centroid: County centroid
Distance facts count only site and address rows and state that denominator.
Other columns
confidence: high when both figures come from the developer or a filing and the site has physical progress or firm contracts; medium when one figure is reported, estimated, or scoped differently than the campus; low when proposed without permits or capacity is an estimate.is_estimate: true when capacity is a Malachi.Energy estimate or investment is a third-party analyst estimate.included_in_aggregate: whether the row counts toward the headline totals. Currently true for every project.comparable_campus_investment: true when the investment basis is developer-stated campus or first-phase cost.last_verified_at: the last release in which every project was re-checked against its source. It trails the dataset version when a release changes only another layer.source_dateis the evidence date.
Licenses
Two layers, two licenses. The verified facility layer is derived from OpenStreetMap and carries the Open Database License (ODbL) 1.0. The mega project tally and the state estimates are Malachi.Energy’s own compilation: free for personal, educational, and editorial use with attribution to Malachi.Energy.
Downloads:Mega projects JSONMega projects CSVStates CSV
These URLs always serve the newest version. For numbers that must not move, cite a frozen release: every version as immutable files with SHA-256 checksums, a changelog, and a citation. Per-state facility lists download from each state page. Full site methodology.
Frequently asked questions
How many data centers are in the United States?
There are an estimated 5,274 data centers in the United States as of October 2026, spread across 46 states, the District of Columbia, and Puerto Rico. That headline is Baxtel's national count. Malachi.Energy allocates it to states using 1,771 facilities verified in OpenStreetMap: Baxtel's own counts for Virginia, Texas, and California (1,884 together), and the remaining 3,390 spread across the other 45 jurisdictions at 3.22 times their verified count. Virginia (388 verified, about 793 estimated), Texas (215 verified, about 779 estimated), and Oregon (134 verified, about 431 estimated) hold the largest shares.
Which state has the most data centers?
Virginia has the most data centers of any US state, with 388 facilities verified in OpenStreetMap and an estimated 793 in total as of October 2026. The cluster centers on Ashburn, Sterling, and Manassas, and the biggest operators there are Amazon Web Services, Digital Realty, and Quality Technology Services. Texas (215 verified) and Oregon (134 verified) rank second and third.
What is the largest planned AI data center in the US?
The largest data center project Malachi.Energy tracks is Advanced Energy Campus (Fermi America) in Carson County, TX, 17.0 GW and about $50 billion, currently announced, targeted for 2027. Among projects already under construction, the largest is Meta Hyperion in Richland Parish, LA, 5.0 GW and about $50 billion, currently under construction, targeted for 2030. Figures are planned capacity from public filings and announcements as of October 2026, not delivered power.
How much electricity do US data centers use?
US data centers used about 192 TWh of electricity in 2024, or 4.7% of total US electricity, according to the United States Data Center Energy Usage Report: 2025 Update, Lawrence Berkeley National Laboratory (June 2026). The same report projects 521 to 843 TWh by 2030, which would be roughly 9.5% to 15.3% of US generation. Direct on-site cooling used about 48 million gallons of water per day in 2023 (LBNL 2024).
Who are the largest data center operators in the US?
By number of OSM-verified facilities in the Malachi.Energy directory, the largest US data center operators are Amazon Web Services (245), Digital Realty (77), Google (71), Microsoft (62), and Meta (59). This ranks mapped sites, not megawatts: hyperscalers with many small facilities rank above colocation providers with fewer, larger campuses. The directory lists 804 operators in total.
How much is being invested in new US data centers?
The 56 mega projects tracked by Malachi.Energy total about $1.2 trillion in announced investment and 106.2 GW of planned capacity as of October 2026. Texas leads with 36.0 GW planned, followed by Ohio (9.3 GW) and New Mexico (9.2 GW). These are announced figures compiled from public filings and press releases; many projects are proposed rather than funded. The total mixes what each figure measures: about $490 billion is developer-stated campus cost, and the remainder is bond authorizations, power plant capex, statewide pledges, press figures, and analyst estimates. Each project's export row and page states its basis.
Are US data center mega projects built near high-voltage transmission lines?
Of the 48 tracked mega projects whose campus location is public to the site or address level, 43 sit within 5 miles of a 230 kV or higher transmission line, per HIFLD transmission data current to September 2023, computed 2026-10-02. The other 8 projects are located only to a city or county centroid, which can sit several miles from the parcel, and are not counted. Proximity to existing 230 kV and higher lines shortens interconnection, which is why announced campuses cluster along them; the figure is a measured distance to the nearest line segment, not a statement about available capacity. Line geometry is from Electric Power Transmission Lines, Homeland Infrastructure Foundation-Level Data. Each project page states its own distance and location basis.
Where is the Stargate data center?
The flagship Stargate data center is in Abilene, TX, developed by OpenAI / SoftBank / Oracle. It is planned at 1.2 GW and about $32 billion, operational with a 2026 target. Related Stargate-branded sites tracked here: Stargate Lighthouse in Port Washington, WI (1.0 GW, under construction), Stargate Lordstown in Lordstown, OH (0.3 GW, under construction), Stargate Milam County in Milam County, TX (1.2 GW, under construction), Project Jupiter (Stargate) in Santa Teresa, NM (2.2 GW, under construction), and Stargate Michigan in Saline Township, MI (1.4 GW, under construction).
Facility data sourced from OpenStreetMap contributors (ODbL). Industry estimates from Baxtel, DOE/LBNL, EIA. Mega project data from public filings and announcements. Dataset version . Maintained by Malachi Rein for Malachi.Energy.